Your Celery Dashboard
Inspect.
Debug.
Monitor.
Celery Made Simple
Born in the trenches
The core features emerged from day-to-day needs and frustrations of developers who use Celery.
Learn More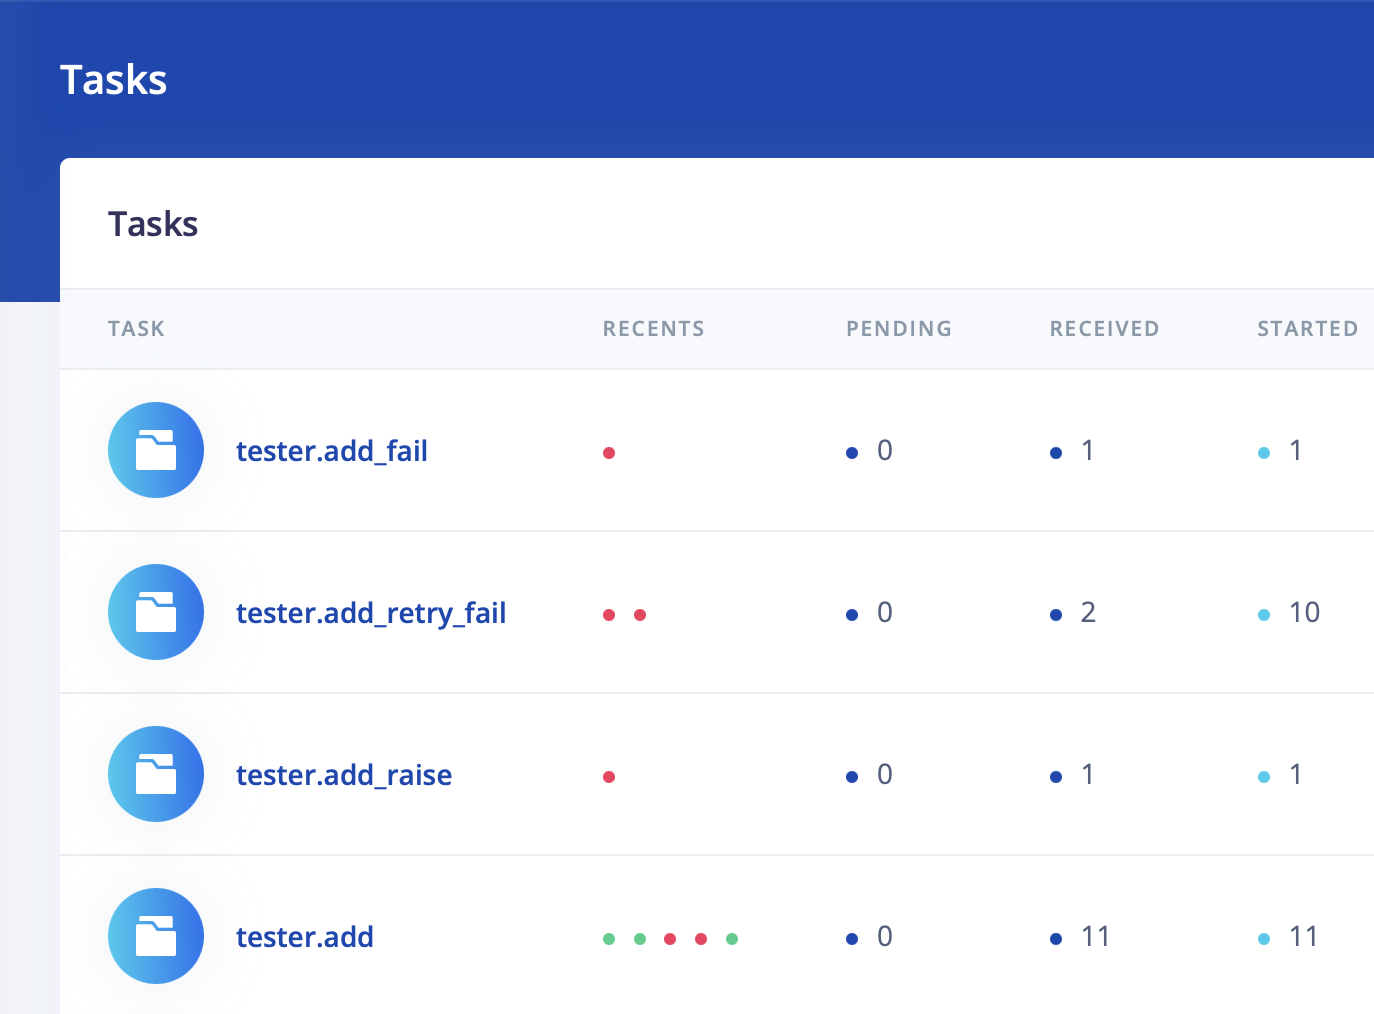
Easy to use, lean UI
Aimed at developers to support their daily workflows instead of being a distraction. This is not a spaceship cockpit.
Learn More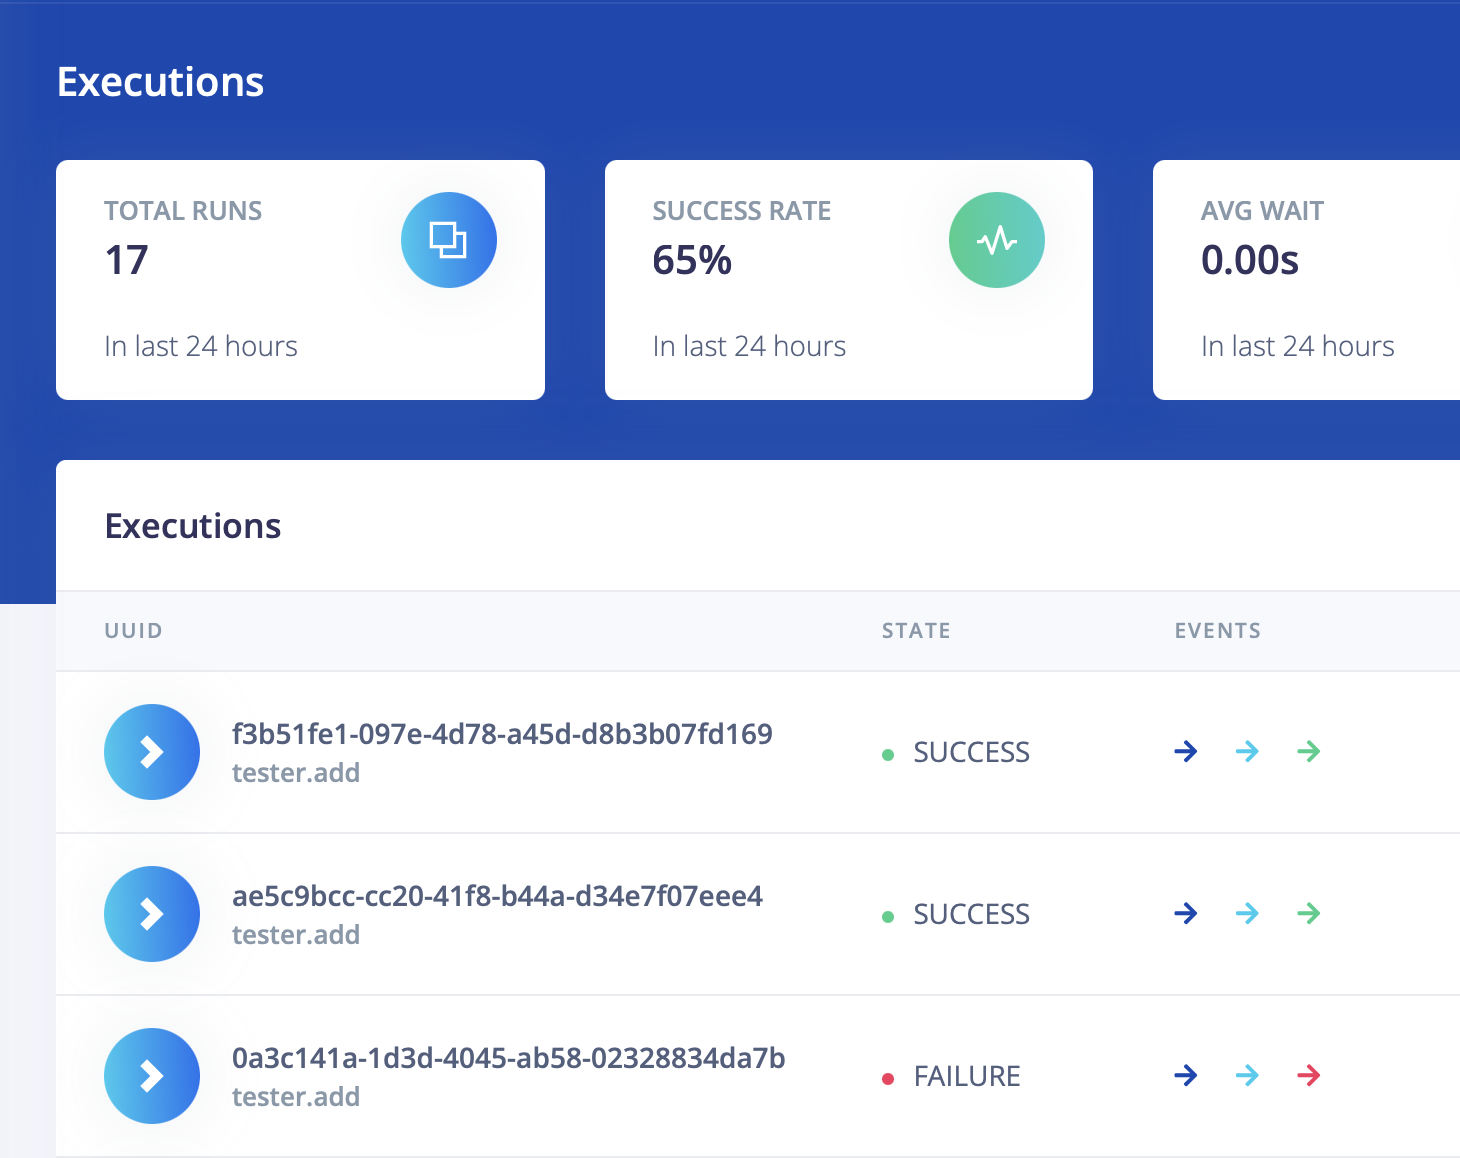
Made for Celery only
This is not a general devops dashboard tool where you plug-in your data to a bunch of meaningless charts.
Learn More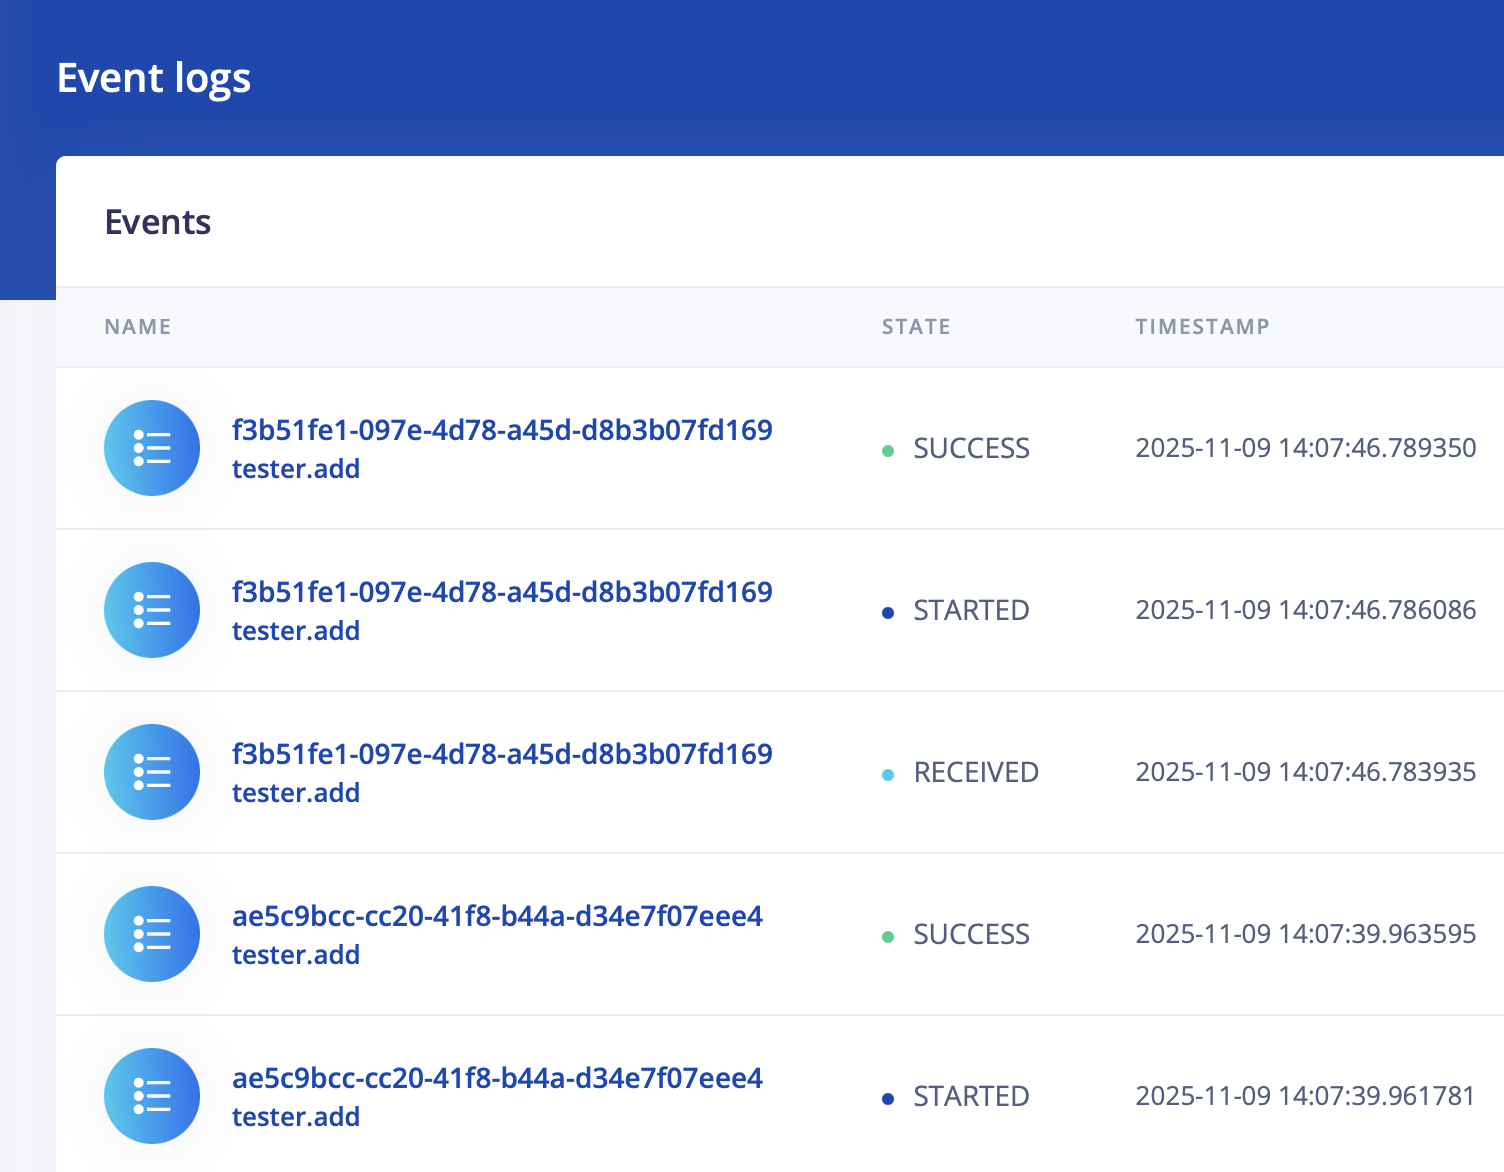
Features That Makes It Work
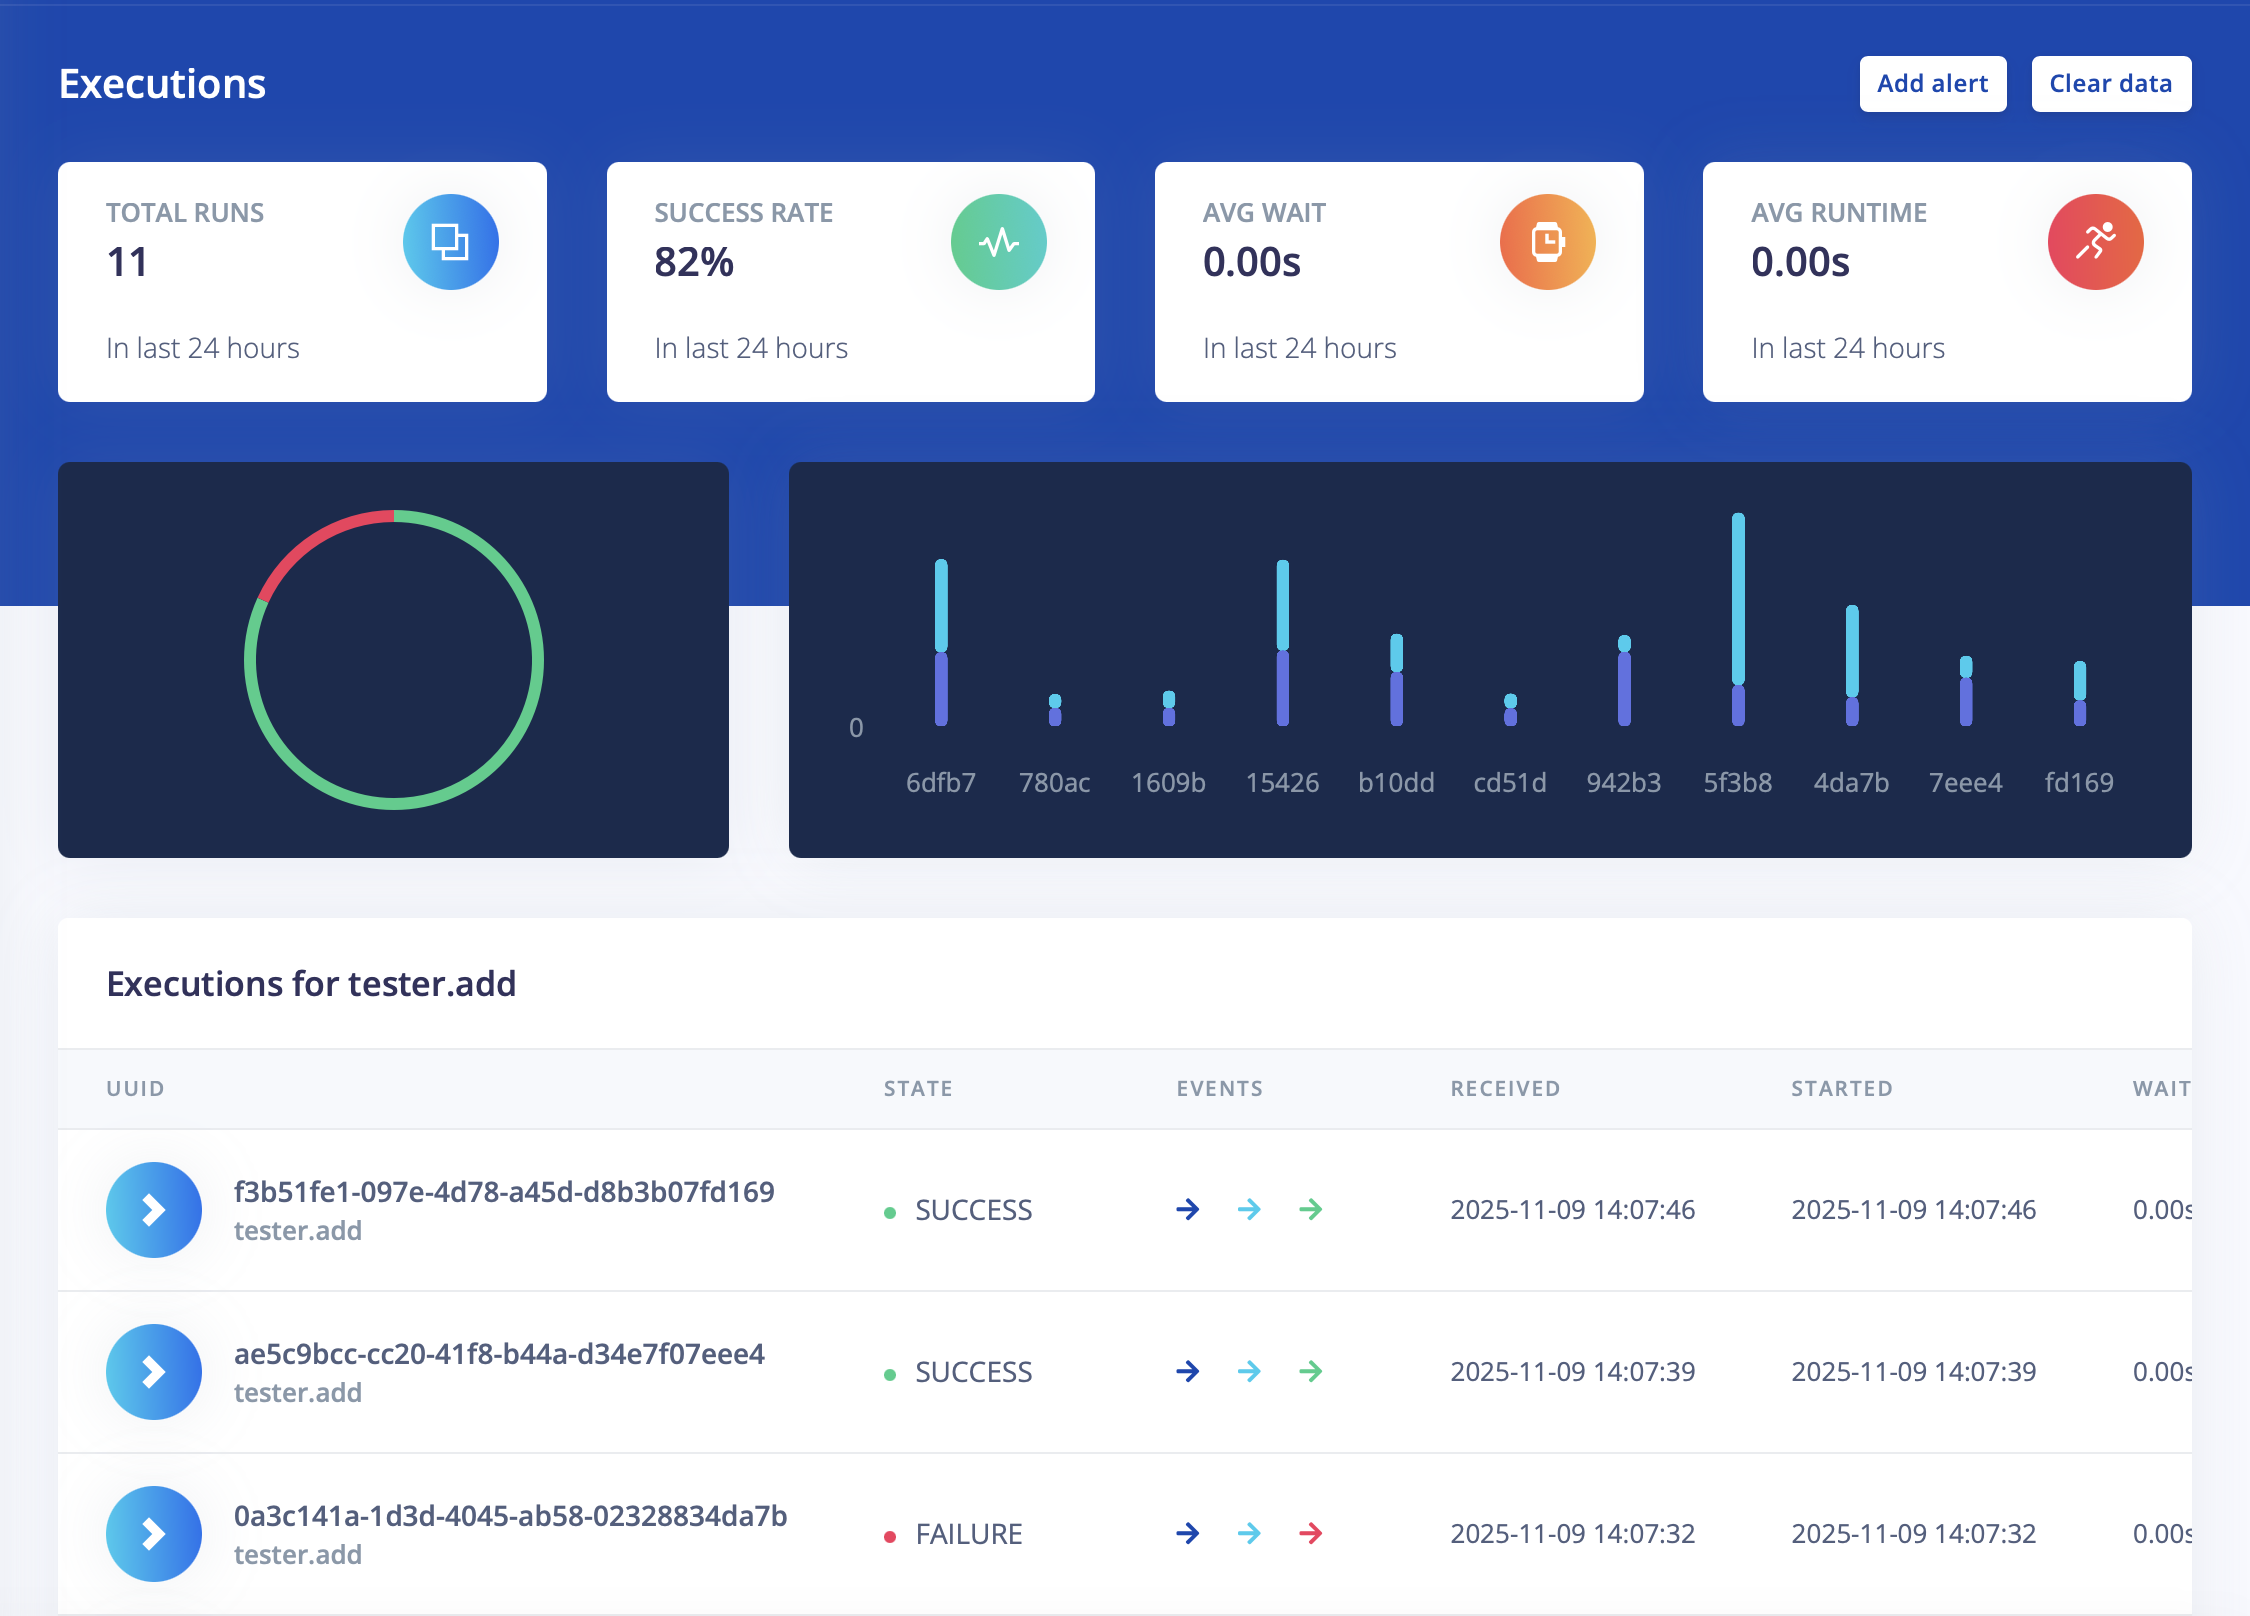
Inspect
See the overall health of your application
-
Collect task statistics like success rate, average runtime, event count
-
See task lifecycle events like started, succeeded, retried, failed
Debug
No more digging in last day's logfile
-
Browse and search timestamped event logs
-
Go into details of events like status, parameters and so on
Monitor
Never miss a critical event
-
Get notified on events like fails or retries
-
Trace back from the given event to see what happened
Choose Your Plan
Every plan comes with a 14 days free trial.
$
29
/month
Starter
For small projects and simple use cases.
- 1 User / 1 Host
- Up to 5,000 executions/month
- 7 days log retention
- E-mail notifications
$
69
/mo
Medium
Ideal for medium projects. Most folks start here.
- Multi User / Multi Host
- Up to 50,000 executions/mo
- 30 days log retention
- E-mail notifications
$
129
/month
Advanced
For complex and heavy projects at scale. Go all in.
- Multi User / Multi Host
- Unlimited executions/mo
- 90 days log retention
- E-mail notifications
- Slack notifications
- Webhooks